Case Study 1: Smartphone Application Classification
Overview
Teaching: 0 min
Exercises: 0 minQuestions
What are the steps to do on a given dataset before performing machine learning?
Objectives
Given a dataset, how to construct a machine learning problem.
Sherlock Smartphone Dataset
In this lesson, we continue to use the Sherlock sample dataset as a hands-on example to introduce machine learning. Readers who are unfamiliar with this dataset are encouraged to review a brief description of Sherlock experiment and dataset in our Big Data lesson.
Introducing the Problem
Smartphones today have become a central place for private information, accounts, contacts, and communication services; this make smartphones an attractive target for cybercriminal activities. In an endeavor to facilitate the development of machine learning and other approaches to increase the security of smartphones, a group of security researchers at Ben-Gurion University of the Negev published “Sherlock”, a massive dataset on smartphone activities.
In this lesson, we use a small subset of Applications.csv table
from the Sherlock’s sample dataset.
This table was created by sampling the system statistics
of the running applications on the smartphones.
We have prepared a small subset containing
over 780k records with 13 features of resource utilization statistics
for two popular applications: “WhatsApp” and “Facebook”.
Objective
We are goint to use the subset of Sherlock’s Applications.csv
to build a model to classify the running applications
based on their resource usage signatures.
We accomplish this by building a machine learning model to learn
the characteristics of resource utilization of different applications.
Each record in the dataset comes with a label, which is the application name.
After the model is trained, we can then use the model to distinguish
the different applications that are currently running on the
smartphone.
To reiterate,
Our machine learning goal is to distinguish which applications are currently running on a smartphone
What Kind of Machine Learning?
Does the smartphone applicaiton recognition problem fall under the category of supervised learning or unsupervised learning?
Under either category, what is the learning subtype of this problem? (I.e., regression, classification, clustering, or dimensional reduction.)
Answer
This is a supervised learning, And the goal of the learning: “distinguish which application” gives a clear hint that we are dealing with a classification problem.
Preparing Working Environment
On your Jupyter notebook, load the following modules to prepare the working environment for the machine learning:
import os
import pandas as pd
import numpy as np
import matplotlib.pyplot as plt
import seaborn as sns
import sklearn
from sklearn import preprocessing
%matplotlib inline
Loading Sherlock Dataset
Before we work with the SherLock dataset, it is important that we get a better idea of the dataset we are working with. We’ll start by taking a look at the dataset features.
Dataset Features
The
sherlock_mysteryDataFrame contains 14 columns (also known as features or variables).Columns and corressponding datatypes described below
Unnamed: 0[int]: Record index
CPU_USAGE[float]: CPU utilization (100% = completely busy CPU).
cutime[int]: CPU “user time” spent the spawned (child) processes
lru[int]: “Least Recently Used”; This is a parameter of the Android application memory management.
num_threads[int]: Number of threads in this process.
otherPrivateDirty[int]: The private dirty pages used by everything else other than Dalvik heap and native heap.
priority[int]: Process’s scheduling priority.
utime[int]: Measured CPU “user time”.
vsize[int]: The size of the virtual memory, in bytes.
cminflt[int]: Count of minor faults that the process’s child processes.
guest_time[int]: Running time of “virtual CPU”.
Mem[int]: Size of memory, in bytes.
queue[int]: The waiting order (priority).Data Loading and Exploration
The first time we obtain new data, it is always a good practice to take a look into the data first.
First, let’s load the dataset into python environment by Pandas
df2 = pd.read_csv('sherlock_mystery_2apps.csv')(We use
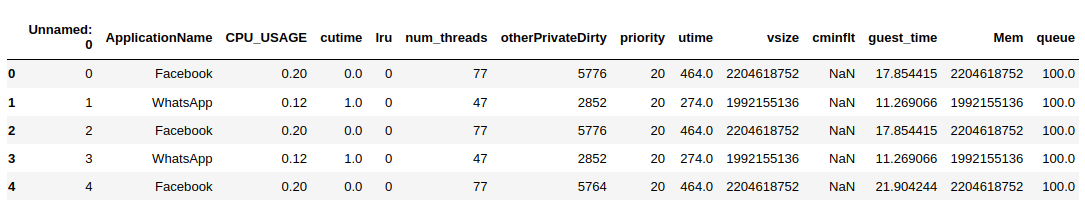
df2, the same name for the dataframe variable as in the previous lesson.) It is always take a initial look at the data by using thehead()command:df2.head(5)Here are the first 5 lines of dataset:
During your initial exploration of the new dataset; you should always use Pandas methods and attributes to answer the following questions:
- How many rows and columns are in this dataset?
- How do the numbers look like?
- How does the statistical information look like?
- What does the feature look like? (i.e. the data types)
Hint: use a combination of the DataFrame attributes
shape,dtypes, and/or methods likehead,tail,describe,info."""Uncomment to perform basic data exploration on df2 DataFrame"""; #df2.describe().T#RUNIT print("df2.columns:") display(df2.columns) print("\ndf2.info():") display(df2.info()) print("\ndf2.head(10):") display(df2.head(10))#RUNIT df2.describe().T
Features
Please take a close look at the dataset:
- How many columns are found in the dataset?
- Consider which columns should be the input (features) and which one should be the output?
- The
NaNin thecminfltcolumn poses a problem in machine learning. Think about what we can do to the missing data.Solutions
There are 14 columns in this dataset. The dataset matrix is 788,587 rows × 14 columns. The column names tell on what kind of information were collected. The following columns are the (possible) inputs to the machine learning model:
Unnamed: 0[int]: The original position of the record in theApplication.csvfile.
CPU_USAGE[float]: The percent of CPU utilization (100.0% = completely busy CPU).
cutime[int]: Amount of CPU “user time” spent the spawned (child) processes, measured in clock ticks.
lru[int]: An additional ordering within a particular Android importance category, providing finer-grained information about the relative utility of processes within a category.
num_threads[int]: Number of threads in this process.
otherPrivateDirty[int]: The private dirty pages used by everything else other than Dalvik heap and native heap.
priority[int]: The process’s priority in terms of CPU scheduling policy.
utime[int]: Amount of the CPU “user time”, measured in clock ticks.
vsize[int]: The size of the virtual memory, in bytes.
cminflt[int]: The number of minor faults that the process’s child processes.
guest_time[int]: Amount of the time running the “virtual CPU”, measured in clock ticks.
Mem[int]: A measure of of memory size, in bytes.
queue[int]: The waiting order (priority).The
ApplicationNamecontains the name of application for which statistics is gathered. It also serves as the output, or label, to the machine learning model.We will cover the issue of missing data in the following episode.
What Applications?
How many applications are covered in this dataset? In other words, how many unique applications are present in the
ApplicationNamecolumn, and how many records for each application?Solution
There are altogether 18 unique applications present in the dataset.
Discussion
Discuss with your peers: What features are intuitive to understand? What features seem relevant for the ML task we have?
Exercise: Which features are numerical, and which ones are not (text, categorical)?
Hint: Use .dtypes to get the data type for each column.
Solution
All the features except for Application Name are numerical.
Training Data (Input and Output)
Earlier we talk about the model (the function f),
the features as the model’s inputs (X), and
the output label (y).
We have an as-yet-to-be-determined model, but we can already
identify the features and the labels in this dataset.
Consider the first record in the dataset above:
0,Facebook,0.2,0.0,0,77.0,5776,20.0,464.0,2204618752,NaN,17.854415,2204618752,100.0
Based on the previous analysis, the CSV header clearly tells us
that the second column (ApplicationName)
is the label that identify which application the sample belongs to
(in this case, the application is “Facebook”).
The other columns are the features (inputs).
One “data point” (datum) will consist of a set of features (the 13 features above) plus the label.
Usually, the features will be presented as a vector of values to the
machine learning algorithm.
Thus the X for this datum can be represented as a Python list (array)
[0, Facebook, 0.20, 0.0, 0, 77.0, 5776, 20.0, 464. 0, 2204618752, NaN, 17.854415, 2204618752, 100.0]
In practice, machine learning algorithm typically takes many data points at once—in that case, we speak of a feature matrix as the input. For our Sherlock dataset, the feature matrix will contain the contents of the CSV except columns 2:
       /                                                        \
      |  0, 0.20, 0.0, 0, ..., NaN, 17.854415, 2204618752, 100.0 |
      |  1, 0.12, 1.0, 0, ..., NaN, 11.269066, 1992155136, 100.0 |
      |  2, 0.20, 0.0, 0, ..., NaN, 17.854415, 2204618752, 100.0 |
{X} = |  3, 0.12, 1.0, 0, ..., NaN, 11.269066, 1992155136, 100.0 |
      |  4, 0.20, 0.0, 0, ..., NaN, 21.904244, 2204618752, 100.0 |
      | ...                                                      |
       \                                                        /
The labels will be laid in a column vector format like this:
       /        \
      | Facebook |
      | WhatsApp |
      | Facebook |
{y} = | WhatsApp |
      | Facebook |
      | ...      |
       \        /
More generally, machine learning might take in a matrix or a higher-dimensional tensor of values as the input features.
Key Points
Understanding a machine learning problem.